‘Act like you have it’: NSW Premier says community transmission is the focus
Predicting the spread of the Wuhan/COVID19 virus from obvious Sydney migrant hotspots and the Ruby Princess would have been a relatively easy process for Premier Berejiklian and her State Emergency Management Committee (SEMC) Chairman,Andrew Cappie-Wood, would have had the GIS capabilities to project the likely spread.
The methods for doing so and well established.Given these methods, which are based on Geographical Information Systems(GIS),logic will dictate that the Special Commission of Inquiry into the Ruby Princess which is to be led by Bret Walker SC will have to examine the culpability of Premier Gladys Berejiklian and her State Emergency Management Committee, which is chaired by Andrew Cappie-Wood.
SEE ALSO
There is no community transmission of this virus in Australia. We have not seen any case of sustained transmission at all in this country. There is no reason for people to be wearing masks.
There's no reason for people to avoid anybody of any particular background or appearance. So I want to reassure the Australian community"
END
Reference
As this CDC Manual demonstrates, anyone with a bit

Geographic Information System Data
Stephanie Foster, Erica Adams, Ian Dunn, and Andrew Dent
Introduction
Place is one of the basic tenets of a field investigation. Both the who and the when of disease are relative to and often dependent on the where. Geographic information science, systems, software (collectively known as GIS) and methods are one of the tools epidemiologists use in defining and evaluating the where. This chapter reviews GIS applications as they pertain to the 10 steps of a field investigation.
Step 1. Prepare for Field Work
Generating Maps for Situational Awareness
Standard mapping techniques will produce informative visualizations and provide orientation for studying the location, the physical attributes of the investigation area, and descriptive characteristics of the population(s) of interest. Field staff should begin by creating general reference maps (1,2). Google Maps (Google, Inc., Mountain View, CA), OpenStreetMap (an open-source wiki software by the OpenStreetMap Foundation), or county geographic files serve as reasonable starting points. These maps can include information about road networks, hotels, airports, and other points of interest to familiarize the field team with the area in which it will be investigating the disease or injury occurrence. Reference maps can be useful in both domestic and international settings, especially in unfamiliar areas.
Additionally, such maps are useful for establishing the boundaries of the investigation area (2–4). Using geographic information science, systems, or software (collectively known as GIS), boundaries can be drawn for the area of interest and from which specific GIS data files, known as shapefiles, can be created (2,4,5). These boundary files can then be used to evaluate variables of interest (e.g., estimating the number of persons residing within a particular area or examining the extent of contamination from a harmful exposure) (Figure 17.1).
Identifying and Acquiring Pertinent Supplemental Data
Time permitting, the field team might consider gathering pertinent data sets useful beyond general reference data. For example, incorporating such sociodemographic characteristic data as population counts, age, sex, race/ethnicity, sensitive populations, language/translation needs, and measures of poverty by specific state, county, or other census boundaries is possible by using US Census data (Figure 17.2). The US Census Bureau makes these data available with a unique geographic identifier, thereby enabling easy association between the population data and the location data in GIS (6).
Understanding the influence of the natural and built environment is possible with GIS (1–3). For example, exploring the distribution of persons in communities and neighborhoods, school locations, childcare facilities, or senior living facilities relative to the locations of industry might prove key to the investigation. During a natural disaster or a chemical release, imagery can be useful for understanding the extent of damage, to track population movements, and to guide the planning and logistics of travel for fieldwork. Furthermore, identifying transportation routes and locations of public utilities might be pertinent to understanding potential transmission modes (Figure 17.3).
GIS can be a principal resource for generating a sampling plan. By using GIS, investigators can select homes or areas within communities for sampling activities (Figure 17.4).
Similarly, investigators can use road network data to develop optimized routes for data collection. Before fieldwork in Panama, for example, researchers used GIS to characterize varying levels of forestation adjacent to villages for study site selection (7). Additionally, the researchers used maps to determine each village’s accessibility.
Depending on the study area’s location (i.e., domestic vs. international), different levels of data might be available. In domestic situations, current and historic data from the US Census Bureau and satellite imagery may be readily available. This might also be true in certain international settings; however, obtaining this information before deployment might be difficult. In those instances, investigators might need to rely on dated or minimally detailed information before beginning fieldwork. Under these circumstances, the team should consider collecting pertinent data after arriving at the location.
Selecting GIS Software and Equipment
Both commercial and open-source GIS packages offer useful software options (4,8). Additionally, statistical software packages with spatial analysis capabilities exist. When selecting a GIS package, the user should consider data collection, analysis, and visualization needs, as well as available technical and financial resources, in determining which package is most feasible.
Developing GIS Capacity
The beginning of the investigation is often the best time to collaborate with a GIS subject matter expert (SME) because that person can provide advice regarding pertinent maps, data, and analysis plans. Engaging GIS SMEs from the beginning can also build GIS capacity among the field team. During 2017, for example, a team from the Center for Global Health of the Centers for Disease Control and Prevention (CDC) collaborated with GIS SMEs in the Geospatial Research, Analysis, and Services Program to determine the best methods for collecting, storing, and analyzing locations where sex workers were active in Papua, New Guinea (9). That collaboration resulted in a plan to determine locations to conduct the surveys, to implement methods for collecting location data, and to enable spatial data analysis, which led to development of an interactive mapping tool. After completion, not only were relevant data collected, but the team began to develop internal GIS capacity.
Summary
- General reference maps can provide situational awareness.
- Maps can be useful for setting the boundaries of the investigation area.
- Maps can be instrumental in developing a sampling plan.
- Publicly available data (e.g., US Census Bureau and health outcome data) can be mapped and evaluated for the particular area of interest.
- Imagery data also might be informative, especially when attempting to assess damage from natural disasters.
- Inviting GIS SMEs to participate in the planning process can build field team capacity.
Step 2. Confirm The Diagnosis
The field investigator might begin extracting location information provided directly from laboratory reports. The patient’s residential street address at the time of diagnosis is often collected along with specimens for laboratory testing. Therefore, these data should be readily available when a laboratory or hospital reports its results. If this information is unavailable through laboratory reports or other electronic records, the field team should consider whether location information will be important to the analysis and determine methods for collecting those data.
Step 3. Determine The Existence Of An Epidemic
GIS for Determining Populations at Risk
When determining whether a particular health outcome is occurring at a greater than expected rate, the correct population at risk must be determined. This often involves estimating a population within a specified geographic area. Census data are readily available at varying geographic units (e.g., block, census tract, county, and state) in files easily processed in GIS (6). Similarly, evaluating census data with GIS can assist in identifying a relevant comparison population. Often, these preexisting geopolitical boundaries are sufficient for estimating population characteristics. However, this is not always the case. For example, wind patterns may carry a contaminant to only a portion of a county or across multiple census tracts, creating nonstandard shapes. GIS can calculate the area of interest and be used to estimate the proportion of area of interest relative to known geopolitical boundaries. This proportion can then be applied to population data to estimate the population of interest (Figure 17.5).
On This Page
- Step 1. Prepare for Field Work
- Step 2. Confirm The Diagnosis
- Step 3. Determine The Existence Of An Epidemic
- Step 4. Identify and Count Cases
- Step 5. Tabulate and Orient the Data in Terms of Time, Place, and Person (Descriptive Epidemiology)
- Step 6. Consider Control Measures
- Steps 7 and 8. Develop and Test Hypothesis(es) and Plan Studies
- Step 9. Implement and Evaluate Control and Prevention Measures
- Step 10. Communicate Findings
- Conclusion
- References
Figure 17.1
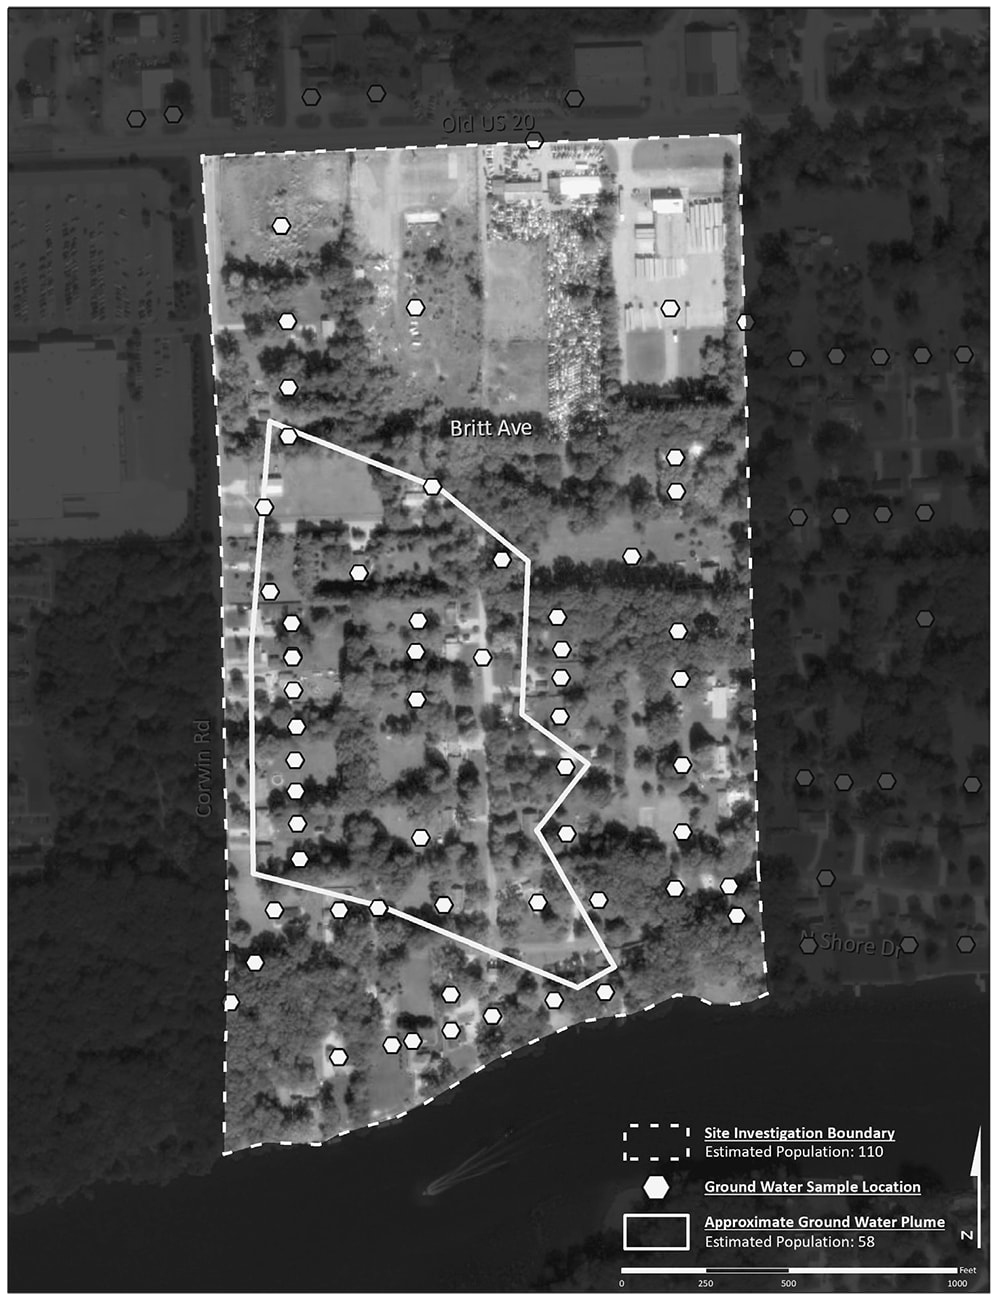
General site profile maps not only provide an overview of the location and spatial
association of the study area to other general points of reference, but also present estimates of
general characteristics of an affected population.
association of the study area to other general points of reference, but also present estimates of
general characteristics of an affected population.
Figure 17.2
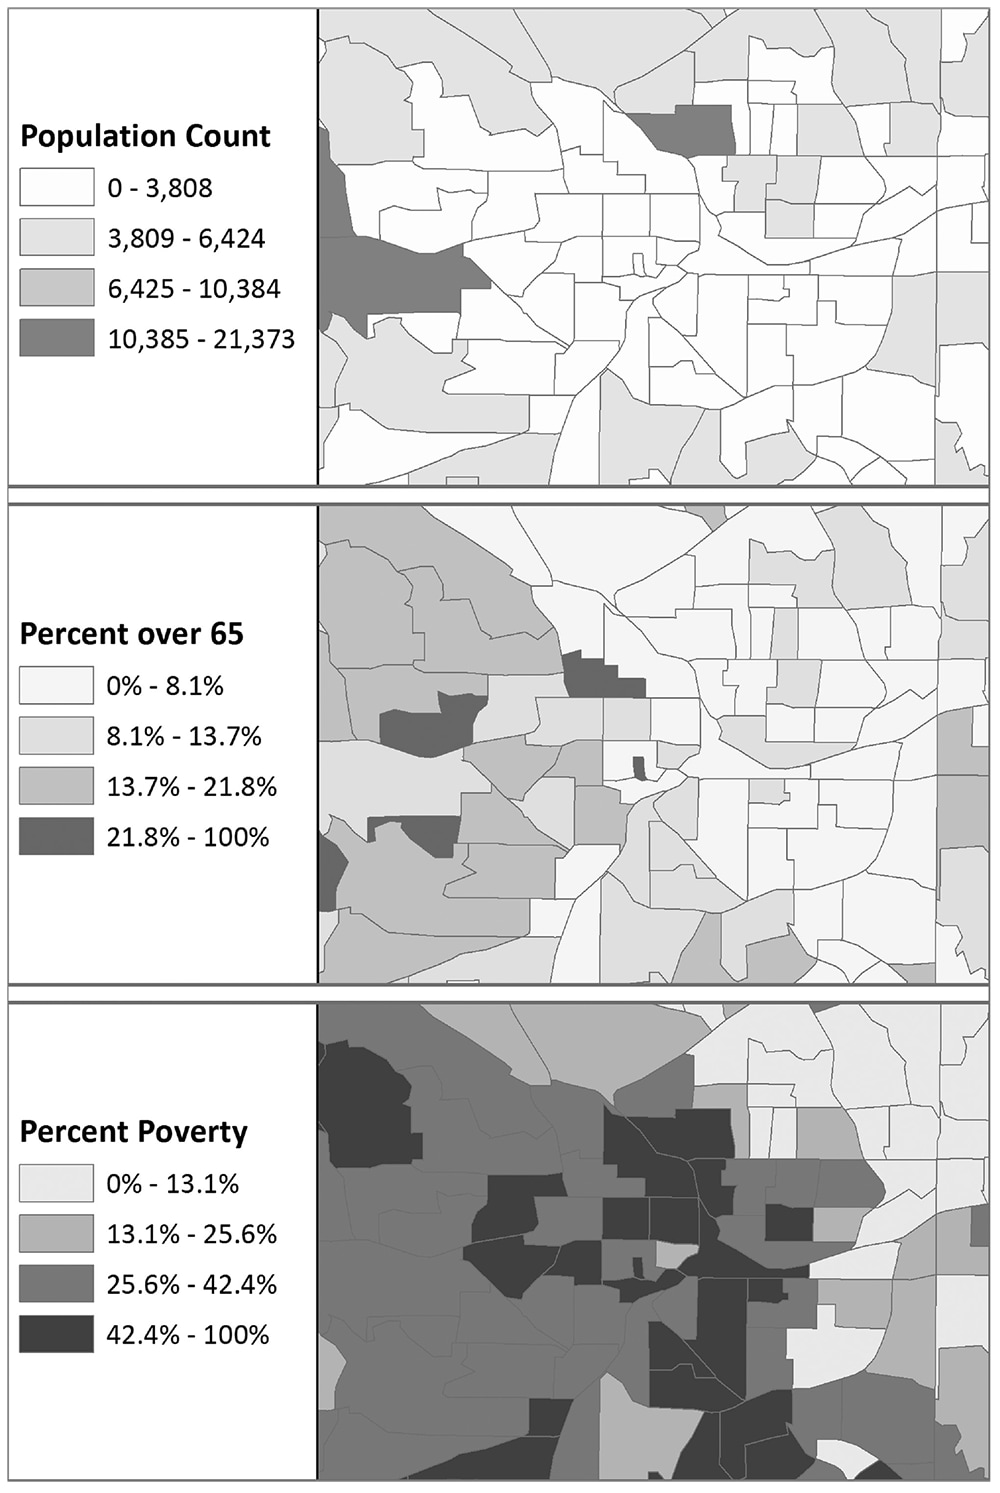
Determining populations and population characteristics. Geographic information
system methods provide the means for determining population estimates within specific geographic
areas for populations of particular interest. In these maps, population count, percentage
of people 65 years old, and percentage of people in poverty based on 2014 American Community
Survey Estimates are shown by census tract.
Figure 17.3
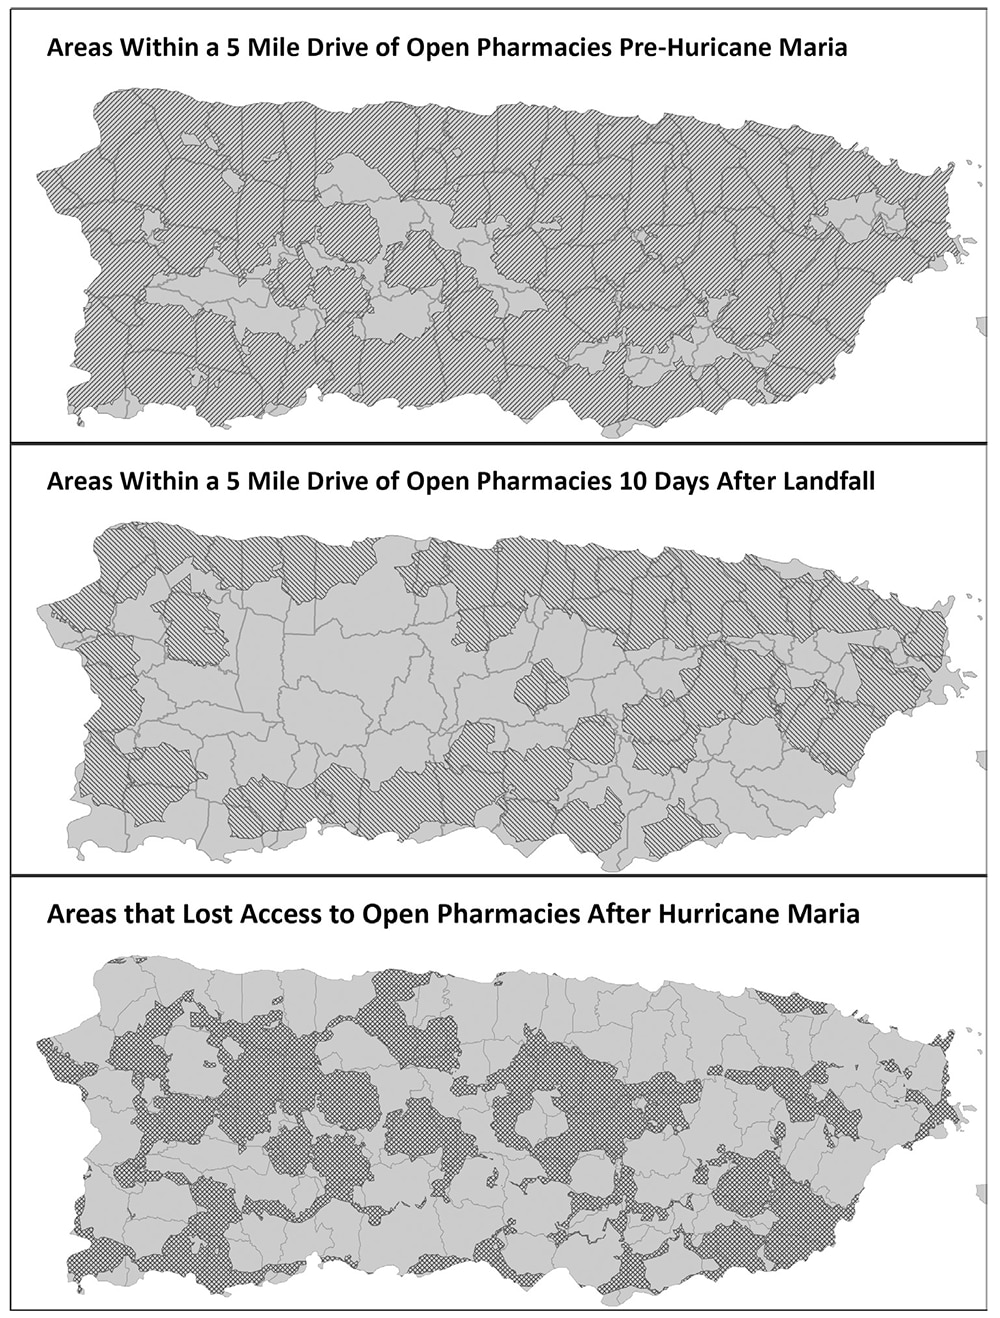
Network analysis. Using road or public transportation networks provides a more accurate analysis of travel times, distances, and connectivity over more traditional buffer methods. Through network analysis, this series of maps demonstrate the change in access to pharmacies as a result of Hurricane Maria’s impact on the island of Puerto Rico.
Figure 17.4
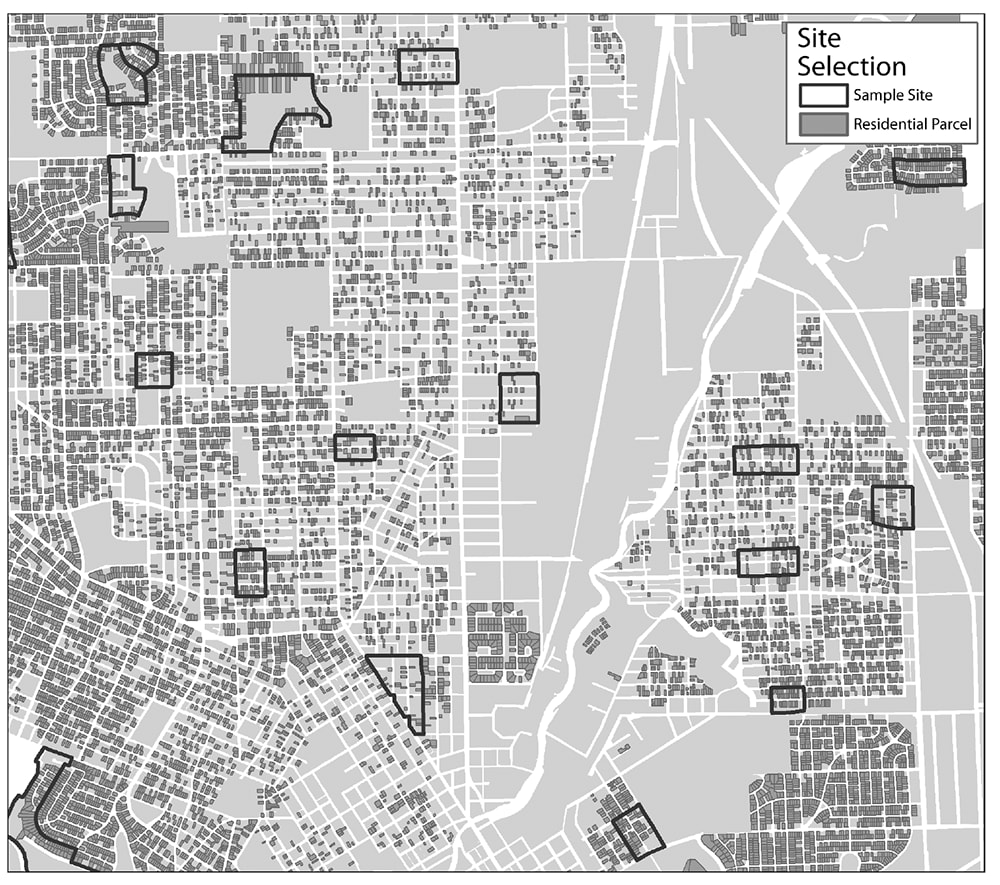
Using geographic information systems for sampling. As shown here, housing data, roads, and neighborhood information can be used to develop a sampling plan when conducting fieldwork.
Figure 17.5
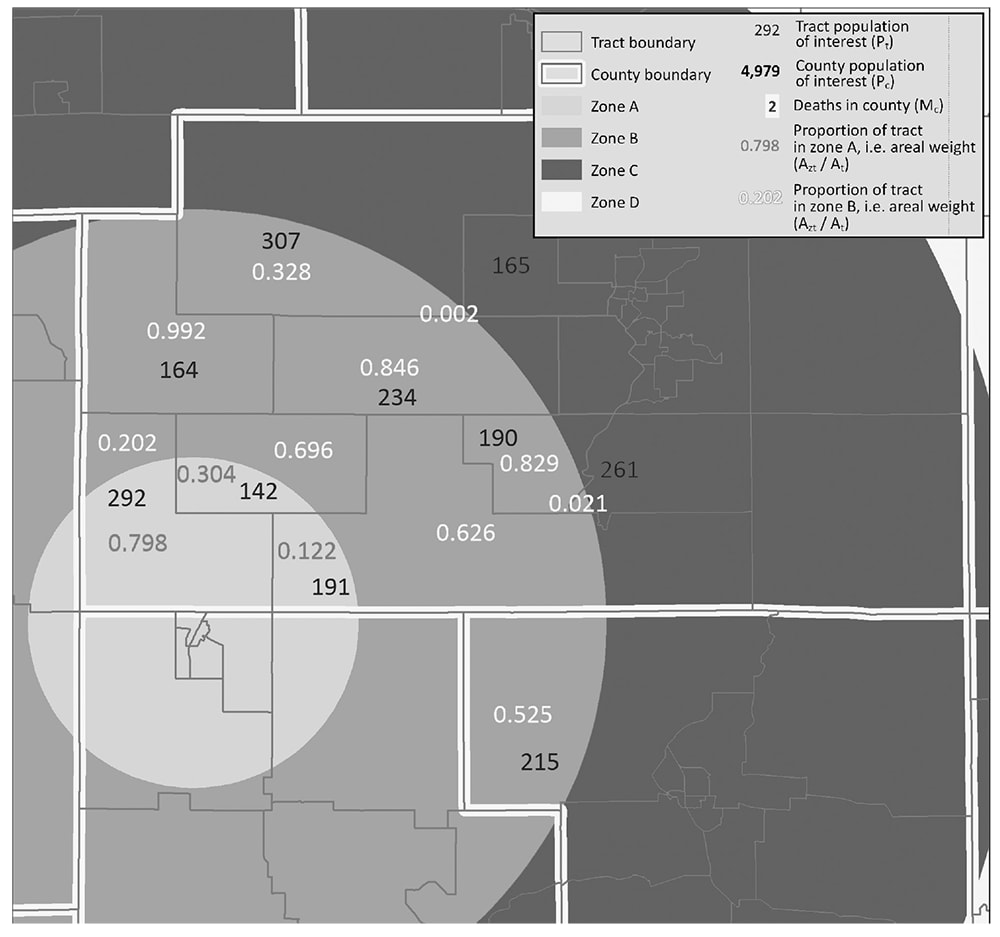
Applying geographic information systems (GIS) to estimate populations of interest within specified areas. Through GIS, it is possible to estimate sociodemographic characteristics when boundaries of interest do not conform to standard political boundaries. These estimates can be calculated by allocating the same proportion of geographic area included in the boundary of interest to sociodemographic characteristics.
__________
Source: Reference 10.
Source: Reference 10.
Exploring Rates Across Space and Time
Preliminary spatial and temporal analyses of baseline rates can be useful at this early investigation stage for establishing an outbreak’s existence. Through spatial and temporal methods, estimates of changing rates of diseases or injury across time might become apparent. A series of static maps can present temporal trends of disease distributions (Figure 17.6).
Linked micromaps, another type of map series, can display rates of disease in the same area across time or different population groups (3,8,11). Additionally, interactive software is available for animating disease distributions across time.
Uncovering Risk Factors
Analysis of environmental risk factors (e.g., wind direction, wind speed, or drinking water sources) can assist in uncovering a common exposure route. GIS can also be used for exploring and defining social networks crucial in understanding disease spread. As the transmission source is determined, a common location might also be revealed. At the least, the field investigator can begin thinking of methods for obtaining location information of patients and suspected locations where infection might be occurring to begin generating hypotheses regarding exposure and transmission factors.
Summary
- Geographic boundaries can be customized to the particular study area and can be used to estimate underlying population counts and characteristics.
- Preliminary spatial and temporal analyses can provide evidence of unusual disease rates across time.
- Visualization can inform the team of potential transmission factors and changing disease patterns across different places and times.
Figure 17.6
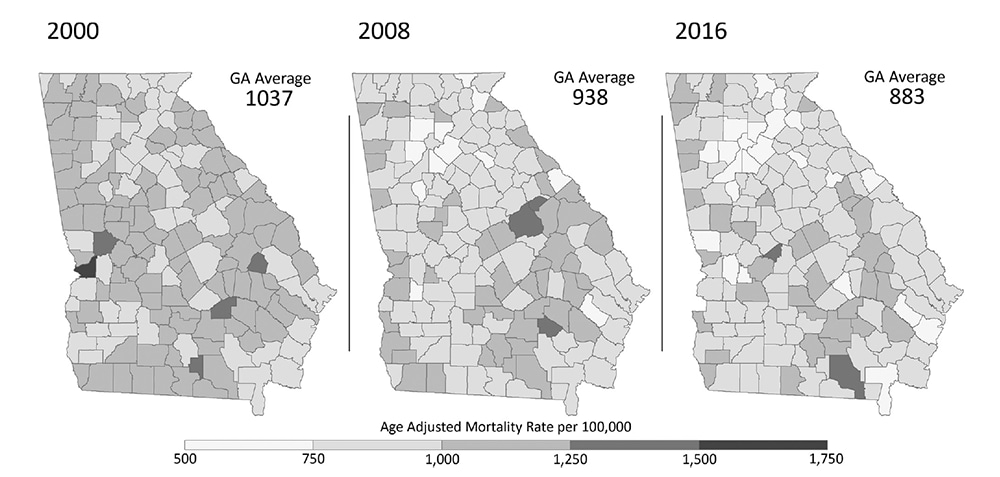
Maps in a series provide an efficient means of presenting different aspects of the same data simultaneously. The series can represent rates among populations with different sociodemographic characteristics, or it might be used to explore changes over time. The decrease in age-adjusted mortality rates in Georgia can be seen in data from 2000, 2008, and 2016.
Step 4. Identify and Count Cases
Collecting and Geocoding Location Data
The street address at the time of disease diagnosis, whether a residence or common establishment, is usually part of routine data collection efforts; however, remembering that location information should be collected in a standardized format is crucial (3). After collection, these data can be converted into points or shapes for mapping, a process known as geocoding (3,12,13). Providing specific instructions for collecting complete and accurate address information can influence correct point placement (3,12).
The field team can determine early on the preferred method for collecting geographic coordinates during data collection in the field (2). Given inconsistencies in complete and accurate address data availability, variability in geocoding software accuracy, and the wide availability of handheld global positioning system (GPS) devices, collecting GPS coordinates might prove better than address data. Additionally, obtaining address-level data for analysis in international settings can be challenging, especially in remote locations where standardized addresses may not be available for data collection or for the geocoding process. For example, throughout the Ebola virus disease epidemic during 2014–2016, infection spread rapidly. In one particularly remote village, the rapid identification of infected persons and their isolation was essential for limiting transmission. During that fieldwork, the investigator was able to use a GPS device to collect the latitude and longitude of each household location while collecting interview data (14). Having these household locations enabled spatiotemporal analysis of transmission risk factors. Without the point locations, examining risk factors at the household level may not have been possible.
In addition to GPS data, network location information from a cellular device might be used to identify location. Today, almost any standard cellular device can generate geographic data. In one instance of fieldwork in Africa, the field investigators used the geotagging function on their cellular phones to take pictures inside their pockets to document their locations.
Beyond Points on a Map
A common misconception is that location can represent only a single position. Collecting spatial data in formats other than points (e.g., lines or polygons) is additionally informative (2–4). Moreover, certain spatial data can represent abstract ideas (e.g., activity space) (15,16). Activity space can include places of employment, houses of worship, residences, restaurants, points of food purchase, recreational areas, friends’ residences, and anywhere else the persons of interest might have frequented. Therefore, when in the field, an investigator should not be limited to recording a street address or assigning a single georeference point.
Visualizing distribution points of contaminated products through road network data can be informative during the case identification process. Other spatial data that might be of interest reflect the movement of materials between facilities and the points of interaction with affected populations. Food products can undergo a lengthy trip from production or harvesting to the consumer and every location along the route. Even the route itself can be a source of risk. Processing locations (e.g., water treatment plants or heating, ventilation, and air conditioning handlers) also can be sources of risk. Collecting data about the locations of and connections between these networks can aid the team’s understanding of the risk factors.
In addition, GIS and location information can be useful in understanding the impact of specific interventions or changes in the natural or built environment. For example, in Atlanta, Georgia, GIS and location information was used to study possible health impacts to residents resulting from the development of a city “Beltline” to improve urban walkability and enhance active commuting (17,18). Field data collection efforts included location and measurement of sidewalk characteristics, walkability, and aesthetics (Figure 17.7). Data were collected for specific road segments, mapped, and spatially analyzed to examine the possible impact of the “BeltLine” on local residents’ health.
Summary
- GIS can be used to specify the place associated with the case definition.
- GIS can be informative for planning field data collection methods.
- The type of analysis will influence spatial data needs and spatial data collection tools.
- Geographic-level data collected during fieldwork will affect the specificity of visualization and the spatial statistical methods during analysis.
- Field investigators should think beyond collection of latitude and longitude, point-level data.
Step 5. Tabulate and Orient the Data in Terms of Time, Place, and Person (Descriptive Epidemiology)
Characterizing the Geographic and Sociodemographic Distribution of Disease
Often, the first look at the data involves creating a map visualizing the disease distribution. Maps can comprise points representing the location of each case or display the geographic distribution of rates or changes in the distribution of counts or rates across time (1–3,8). Both count and rate data can be aggregated to different geographic units (e.g., census tracts, counties, or zip codes). The technique known as choropleth mapping visualizes the intensity of the counts or rates by using boundary aggregations (Figure 17.8) (1–3,8). Selecting classification breakpoints and color schemes are chief considerations (8,19).
Analyses do not have to be restricted to commonly used geopolitical boundaries. For example, mapping the accumulation of cases among homes within a village might be useful. With this information, choropleth maps of the number of cases, or rates, within each home can be compared with the quantity in other homes within the study area. Another possibility is for the map to represent the location of cases in rooms in a building (e.g., in a hospital or nursing home).
GIS Operations and Their Utility
Point-level analyses of cases can provide an overview of the extent of disease distribution. Point-level data also are needed for evaluating spatial clustering of disease. Alternatively, service area or activity space analyses can help characterize the extent of disease distribution on a more relative and temporal scale. As previously mentioned, another advantage of GIS is incorporating other spatially related information into the analysis, thus providing context for disease patterns and insights regarding place-based risk factors. For example, during the 2016 Flint, Michigan, shigellosis outbreak, cases were aggregated by census area for reporting and visualization. In doing so, the team was able to examine the case rates in relation to reported water-quality events, thus leading to more in-depth spatial analysis (20).
Providing Context with Supplemental Data
Analyzing supplemental data (e.g., environmental or infrastructure data) enables further contextualization of the public health problem. For example, during the investigation of elevated lead levels in Flint, Michigan, water supply system data were important for understanding the common source of contamination and identifying particularly vulnerable populations (i.e., child residents). Similarly, waterline information was used to model chlorine residuals to understand a later outbreak of shigellosis in the same area (20).
Another resource is remotely sensed data. Remotely sensed data can include aerial and satellite images, or they can be data collected by sensors on satellites orbiting in space (2). Remote sensing techniques can aid in locating key geographic features or monitoring change across time. Imagery can be particularly useful in preparing for responses to natural disasters by providing an aerial view of environmental and infrastructural damage and stranded populations. For example, after Hurricane Harvey’s landfall in Texas in 2017, field investigators analyzed satellite imagery to predict and prevent mold exposure. After the 2010 earthquake in Haiti, satellite imagery was used to locate stranded populations and to identify the locations to which affected residents were moving to find shelter. During the 2016–2017 Zika virus infection response in Puerto Rico, spectral signature remote sensing techniques were used to locate standing water, which served as a breeding ground for Aedies egypti mosquitos potentially carrying the Zika virus (Figure 17.9).
Visualizing Disease Across Time
GIS can be used to visualize disease progression, changing concentrations, or distribution of risk factors across time. Static map series, linked interactive micromaps, and animations are methods for such visualization. An animation of the spread of Ebola virus infection among households and the institution of household-wide and village-wide isolation and quarantine efforts in Sierra Leone was particularly informative in understanding the outbreak’s epidemiologic curve (14). New tools are also being developed to visualize the slope of an epidemiologic curve for every geographic unit within a study area. As the direction and magnitude of this slope is mapped, a visualization of the stage, magnitude, and geographic distribution of an outbreak can be realized.
Summary
- Mapping count and rate data describe disease distribution and potential risk factors whether at the county, household, or room level.
- Supplemental data add another dimension to the analysis, enabling further contextualization of the public health problem.
- Environmental, infrastructure, transportation networks, water systems, and satellite imagery are common supplemental resources.
- Linked micromaps and animations are helpful for describing disease distributions across time.
Figure 17.7
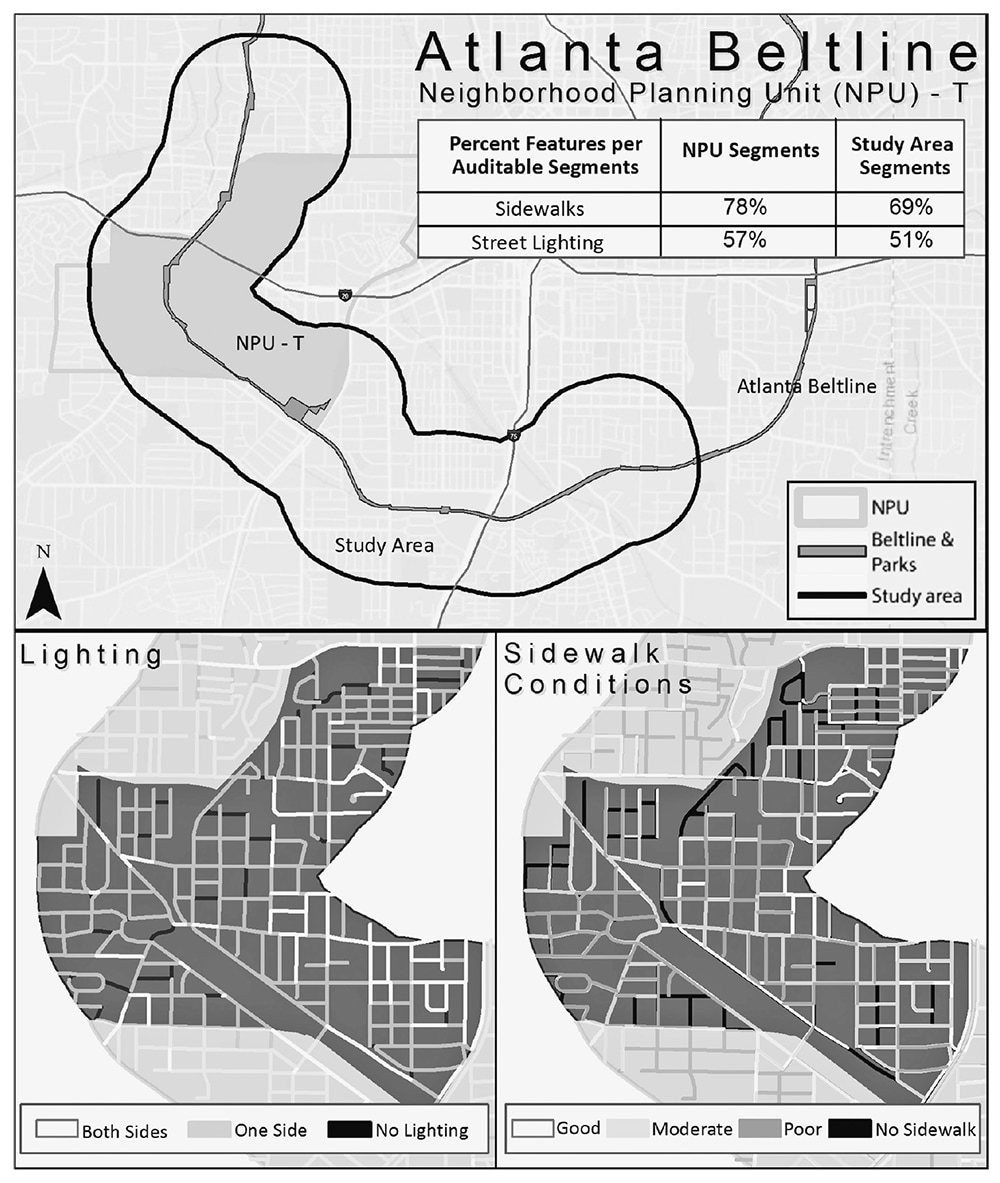
Collecting data regarding the natural or built environment. Geographic information system data about the natural or built environment can be collected in the field, mapped, and spatially analyzed. This map characterizes data about walkability in a study area around the Atlanta BeltLine.
Figure 17.8
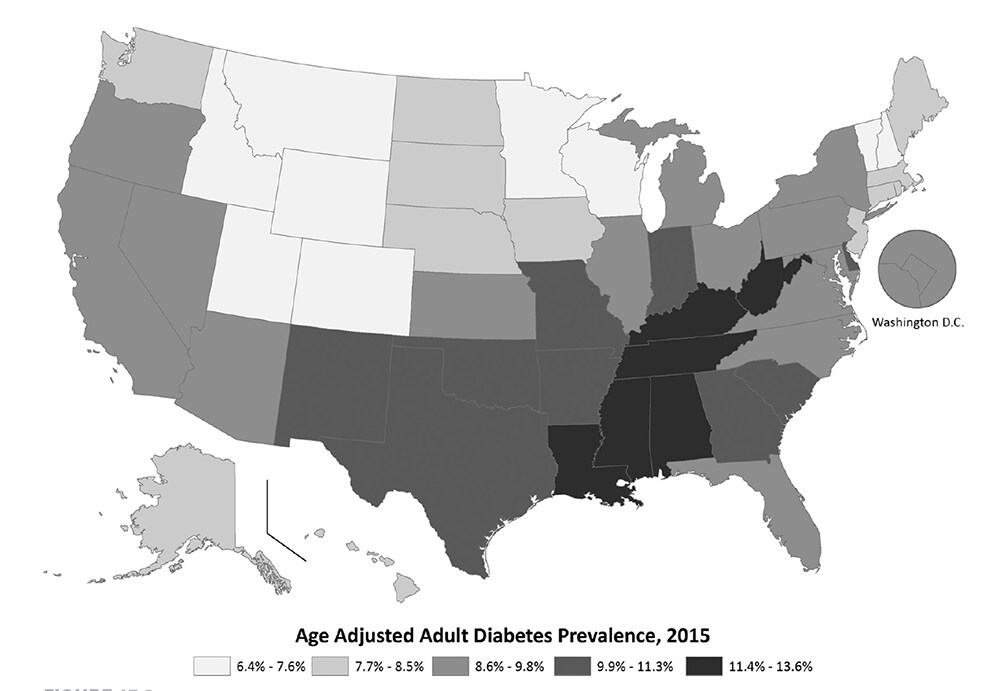
Choropleth maps offer an overview of the variation in disease distribution through the use of color to denote value differences. Darker colors are often associated with greater values.
Figure 17.9
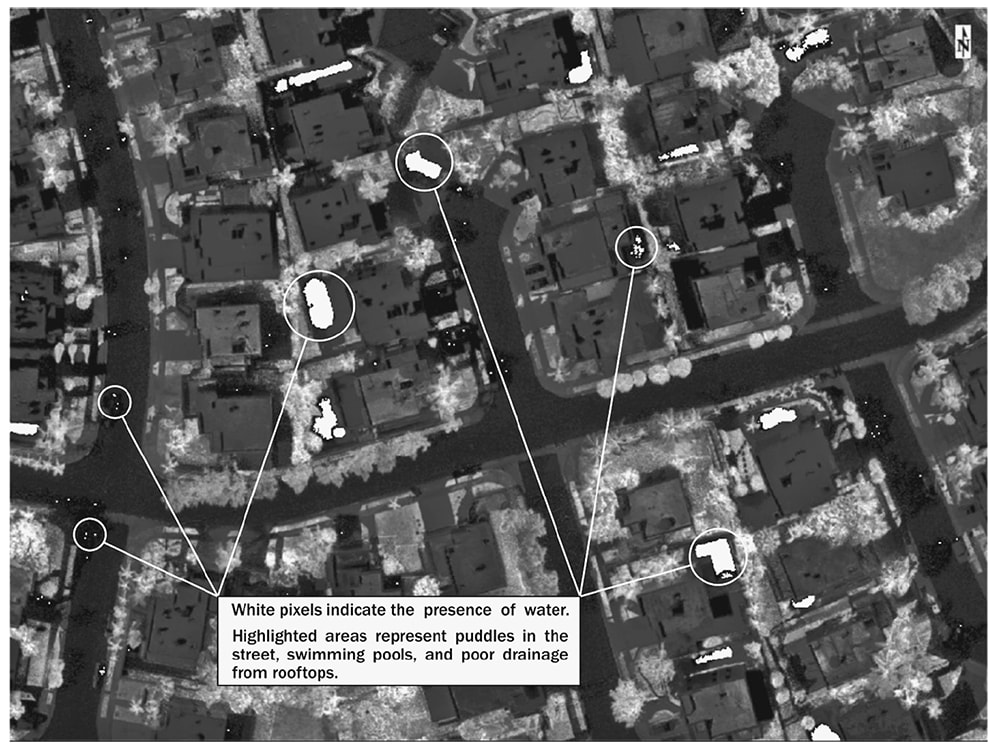
Imagery analysis. Aerial photography and satellite imagery can provide data to extract key features in the environment. In this example, image classification of aerial imagery was used to identify potential mosquito habitats given the presence of water.
Step 6. Consider Control Measures
Selecting Control and Prevention Locations
Maps and geostatistical results can guide decisions about when and where to implement control, prevention, and surveillance measures. During outbreaks related to environmental exposures or vectorborne diseases, results can delineate areas of highest need or uncover potentially new reservoirs of disease spread. During the 2016–2017 Zika virus infection outbreak, the vector-control unit in Puerto Rico used GIS techniques to delineate population-based regions for placing mosquito traps. Data collected from these traps were visualized, and the resulting maps were used to estimate Zika virus in a heavily affected area of Puerto Rico. During that same response, the epidemiology unit used GIS to intersect data characterizing women of childbearing age and weekly changes in Zika virus infection incidence by county to determine where to focus educational interventions and to distribute Zika virus infection prevention kits.
Summary
- Visualization of rates through mapping enables identification of probable locales for implementing control and prevention measures.
- Results from geospatial analyses are useful for determining areas of highest need, predicting future locations of concern, and identifying particular populations at risk.
Steps 7 and 8. Develop and Test Hypothesis(es) and Plan Studies
Using Geospatial Descriptive Results to Generate Hypotheses
Maps generated from descriptive results can assist in generating theories about possible routes of exposure and interactions between risk factors and susceptible populations. Using maps and the results of the descriptive analysis can guide hypothesis development regarding disease-causing agents, the transmission mode, and exposure locations. With this information, the field team might determine the need for additional analyses, perhaps applying other advanced geospatial statistics to further understand the spatial and temporal associations between suspected risks and disease.
Geospatial Analytical Methods for Study Design
Creating risk maps by using spatial overlays and using interpolation methods to estimate values in an unsampled location or spatial regression techniques can be used to further understand the geographic distribution of potential risk factors or disease processes (3,21). Cluster analysis provides the researcher with quantifiable, statistical estimates to evaluate whether similar values occur near one another and whether these occurrences are nonrandom (3,21). Cluster analysis can be highly useful in hypothesis generation and risk factor evaluation regarding place and time. An overview of selected advanced and inferential spatial techniques that can be useful in hypothesis redefinition and development of additional studies is provided (Table 17.1).
Summary
- Results of mapping and spatial analyses provide information pertinent to generating study hypotheses.
- Geospatial methods can generate estimates for areas where only limited data might be available, thus assisting in generation of additional investigations.
- Cluster analysis is useful in providing statistical evidence of nonrandom disease processes.
Step 9. Implement and Evaluate Control and Prevention Measures
Short- and Long-Term Geospatial Approaches for Evaluation
Geospatial methods described thus far are also useful for understanding the impact of control and prevention efforts. In particular, visualization of rates by location can highlight locales where control measures might be more or less effective. Identifying these places and then uncovering factors influencing the efficacy of such measures can be useful in determining whether changes to control measures are required, and, if so, where changes might be necessary. For example, researchers can track changes in opioid-related death rates in different locales to identify where efforts are working or not (22).
Spatiotemporal analysis provides researchers tools for exploring and quantifying complex associations between disease risk factors and prevention activities. Using the opioid overdose epidemic example, geospatial methods revealed the impact of the placement of prevention measures (e.g., treatment locations, recovery resources, or prescription drop boxes) (22). Researchers can use time-series animations, map series, linked micromaps, and spatiotemporal modeling to evaluate these types of trends. Transit times and healthcare service area analyses can reveal missed opportunities for prevention or highlight areas where specific interventions are successful. Such information can be useful in determining where additional resources and control measures are necessary.
Table 17.1
Summary
- Locales where control measures prove effective can be identified through mapping.
- Mapping and spatial analyses can uncover factors influencing the efficacy of control measures, thus enabling researchers to modify programs accordingly.
- Network analysis, time-series animations, map series, linked micromaps, and spatiotemporal modeling are methods for evaluating long-term trends.
Step 10. Communicate Findings
Efficient and Effective Communication Through Mapping
Maps are one of the most efficient ways to quickly guide situational awareness and communicate place-related information about incidence, prevalence, environmental or infrastructural exposures, and other related spatial information. During major disease outbreaks (e.g., Zika and Ebola virus infection outbreaks), weekly maps helped visualize incidence and geographic shifts in disease presence. After Hurricane Maria devastated Puerto Rico in 2017, CDC’s Medical Care and Counter Measures Task Force used interactive Internet-based maps to access open-source data regarding the location and status of pharmacies, hospitals, and other health infrastructure. The information these maps provided was essential in determining where best to direct medical resources.
Maps provide essential situational awareness and communicate findings to response agencies and local authorities. Moreover, they can be used to readily share information with affected populations. For example, during the 2016– 2017 Zika virus infection outbreak in Puerto Rico, the island’s health department published weekly Internet-based maps of case counts and incidence, providing the public with updated information about how the outbreak was changing (23).
Summary
- Maps quickly reveal and communicate place-related information about disease distributions and disease processes.
- Maps provide essential information for directing healthcare resources and focusing prevention and control measures.
- Maps are useful in communicating with multiple stakeholders.
Conclusion
This chapter has highlighted GIS techniques, resources, and methods integral to the 10 steps of the field investigation process. GIS can provide the tools to further identify and define the where of a field investigation. Striking the balance between the need for situational awareness with rapid, yet complete and accurate spatial data is an art. It requires consideration of the strengths and limitations of data collection instruments, facility of locational data collection, accuracy of locational data, and pertinent attributes for understanding disease risk.
Ultimately, collecting relevant location data is only one part of a field investigation, but location data are nonetheless a principal part and should be considered from the very beginning of an investigation. One solution does not fit all field investigations. No one single spatial data collection method or analysis is best suited for every field investigation scenario. Therefore, GIS is one tool in the field investigator’s toolkit not to be overlooked.
References
- Dent BD, Torguson JS, Hodler TW. Cartography: Thematic Map Design. 6th ed. New York: McGraw-Hill Higher Education; 2008.
- Campbell J, Shin M. Essentials of geographic information systems. https://open.umn.edu/opentextbooks/BookDetail.aspx?bookId=67
- Cromley EK, McLafferty SL. GIS and Public Health. 2nd ed. New York: The Guilford Press; 2012.
- de Smith MJ, Goodchild MF, Longley PA. Geospatial analysis: a comprehensive guide to principles, techniques and software tools. 5th ed. http://www.spatialanalysisonline.com/HTML/index.html
- Mitchell A. The ESRI guide to GIS analysis. Volume 1: geographic patterns & relationships. Redlands, CA: ESRI Press; 1999.
- US Census Bureau. TIGER products. https://www.census.gov/geo/maps-data/data/tiger.html
- Dyer J, Tanner S, Runk J, Mertzlufft C, Gottdenker N. Deforestation, dogs, and zoonotic disease. Anthropology News. 2016;57:344–7.
- Geography and Geospatial Science Working Group. Cartographic guidelines for public health. https://www.cdc.gov/dhdsp/maps/gisx/resources/cartographic_ guidelines.pdf
- White RG, Hakim AJ, Salganik MJ, et al. Strengthening the reporting of observational studies in epidemiology for respondent-driven sampling studies: “STROBE-RDS” statement. J Clin Epidemiol. 2015;68:1463–71.
- Hallisey E, Tai E, Berens A, et. al. Transforming geographic scale: a comparison of combined population and areal weighting to other interpolation methods. Int J Health Geogr. 2017;16:29.
- Pickle L, Carr D. Visualizing health data with micromaps. Spat Spatiotemporal Epidemiol. 2010;1:143–50.
- Goldberg D. A geocoding best practice guide. https://20tqtx36s1la18rvn82wcmpn-wpengine.netdna-ssl.com/wp-content/uploads/2016/11/Geocoding_ Best_ Practices.pdf
- Rushton G, Armstrong MP, Gittler J, et al. Geocoding Health Data: The Use of Geographic Codes in Cancer Prevention and Control, Research and Practice. Boca Raton, FL: CRC Press; 2008.
- Gleason BL, Foster S, Wilt GE, et al. Geospatial analysis of household spread of Ebola virus in a quarantined village—Sierra Leone, 2014. Epidemiol Infect. 2017:145:2921–9.
- Lewin K. Field Theory in Social Science. Cartwright D, ed. New York: Harper and Row; 1951.
- Schönfelder S, Axhausen KW. Urban Rhythms and Travel Behaviour: Spatial and Temporal Phenomena of Daily Travel. Burlington, VT: Ashgate; 2010.
- Wilkin HA, Gallashaw C, Gayman M, Mingo C, Steward J, Kolling J. Community engagement and inclusion in research about the potential impact of changes in the built environment on the community. Presented at the American Public Health Association Annual Meeting and Exposition, November 7, 2017, Atlanta, Georgia. https://apha.confex.com/apha/2017/meetingapp.cgi/Paper/385571
- Kanchik M. A Secondary Analysis of walkability data for the Atlanta BeltLine communities. https://scholarworks.gsu.edu/iph_capstone/79/
- Brewer CA. Designing better maps: a guide for GIS users. Redlands, CA: ESRI Press; 2005.
- McClung RP, Castillo C, Miller A, et al. Shigella sonnei outbreak investigation in the setting of a municipal water crisis—Genesee and Saginaw Counties, Michigan, 2016. Presented at the 66th Annual EIS Conference, April 24– 27, 2017, Atlanta, Georgia. https://www.cdc.gov/eis/downloads/eis-conference-2017.pdf
- Waller LA, Gotway CA. Applied Spatial Statistics for Public Health Data. Hoboken, NJ: John Wiley and Sons; 2004.
- Lindemann J. Oakland County, Michigan using data and maps to help understand and combat the opioid epidemic. New America Public Interest Technology blog. https://www.newamerica.org/public-interest-technology/blog/oakland-county-michigan-using-data-and-maps-help-understand-and-combat-opioid-epidemic
- Gobierno de Puerto Rico, Departamento de Salud. Informe semanal de enfermedades arbovirales [in Spanish]. http://www.salud.gov.pr/Estadisticas-Registros-y-Publicaciones/Pages/VigilanciadeZika.aspx

No comments:
Post a Comment